Images of Theme Dresses
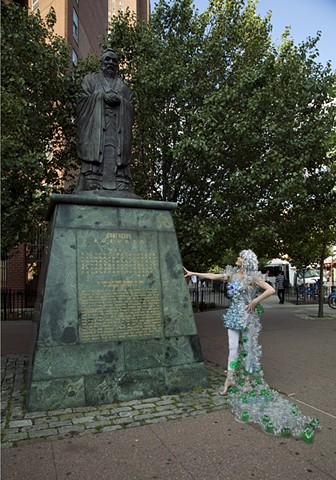
Artist wearing the Increasing Revenue Gap Dress standing beside the Confucius statue in New York
This dress presents the data of CEO earnings versus the employees average salary for the 350 largest US corporations from 1965 to 2013
The central dark blue bottle bottom represents the average employee's salary. The other bottles around represent the CEO earnings.
-The front of the dress shows the 1965 data where the dark blue bottle is surrounded by 20 light blue bottles. That is CEOs earned 20 times more than the average employee.
-Then we may compare this ratio with the back of the dress where the ratio of 2013 is now 1 to 296. This dress shows the contrast in real space with real objects between the 1965 and the 2013 data.
-Let us see how it evolved from a ratio of 20 times to 296 times. The back of the short dress shows the 1978 ratio when the CEO earnings is 30 times the salary of the average employee
-Then sleeves are added to reach the 1989 ratio of 1 to 59
-Then (63) bottles are added to the back of the skirt, to reach the 1995 ratio of 1 to 123
-Then another 173 bottles are added to form a train and reach the 2013 ratio of 1 to 296
Data source is EPI.org. The OECD has published very similar data but it did not go as far back.
